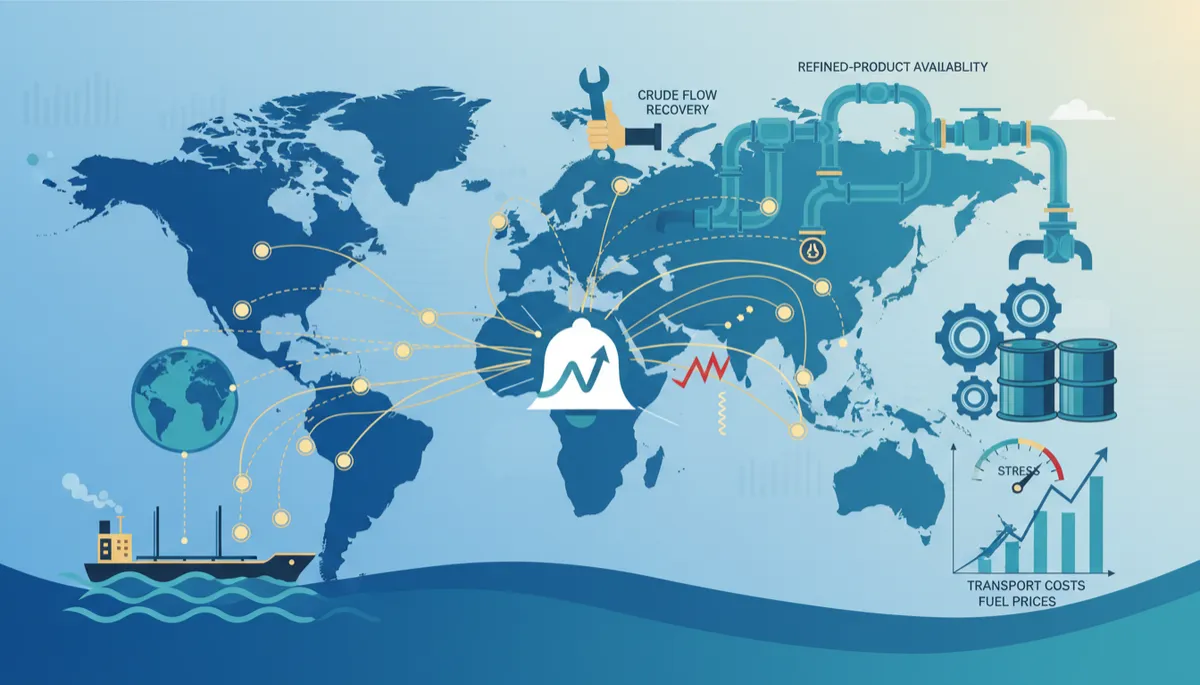
Global Oil Supply & Transportation Stress Index
Energy Markets, Global Trade, Oil Logistics
The New Bell‑Weather Report - "Global Oil Supply & Transportation Stress Index"
How a new way of looking at crude, refined fuels, and shipping costs reveals a stark truth: the world is solving the crude‑transport problem faster than it is solving the refined‑fuel problem.
A New Lens on a Strained System
There is no officially published metric called the “Global Oil Supply & Transportation Stress Index”—yet the concept is increasingly useful. By combining insights from the International Energy Agency (IEA), OECD, BIS and composite measures like the Global Supply Shock Index, we can sketch a practical, bell‑weather style gauge of how stressed the world’s oil system really is in 2026.
This “index” is not a single number but a structured way of reading the market: tracking crude, refined products, allocations, transport costs, and the impact of nationalization and hoarding by key producer states. It also folds in crude flow recovery, geopolitical risks at the Strait of Hormuz, and the widening disparity between crude logistics and refined‑product availability.
📌 Central Argument: The world is solving the crude‑transport problem faster than it is solving the refined‑fuel problem. Tankers and alternative routes are coming back online; refineries and product logistics are lagging badly.
Crude: Supply, Flows, and a Fragile Recovery
On the crude side, the story in late 2026 is one of partial healing under persistent risk. The IEA’s September 2026 Oil Market Report pegs global oil supply around 100–101 million barrels per day (mb/d), still below pre‑conflict levels and well under where the agency expected the market to be a year ago. Supply disruptions in the Middle East—especially linked to the Strait of Hormuz crisis—have taken more than 10–12 mb/d of Gulf capacity offline at various points (IEA, BIS).
Yet there are clear signs of crude flow recovery. Non‑Gulf output, particularly in the Americas and Africa, has rebounded—non‑OPEC supply rose roughly 1.8 mb/d from May to June 2026. Meanwhile, U.S. production is at or near record highs, averaging about 13.7–13.8 mb/d in the first half of 2026, led by the Permian Basin and Gulf of Mexico projects (EIA). Tanker traffic, while far from normal, has resumed through Hormuz, and alternative pipeline routes from Saudi Arabia and the UAE are absorbing some of the displaced volumes.
💡 Interpreting the Index on Crude: Crude supply is constrained and risky, but the system is innovating—rerouting tankers, boosting non‑Gulf production, and drawing on strategic stocks—to keep barrels moving.
Refined Products: The Real Bottleneck
Where the system is truly breaking down is in refined products—gasoline, diesel, jet fuel, marine fuel and petrochemical feedstocks. Global refining throughputs in August 2026 were roughly 81.4 mb/d, more than 4 mb/d lower than a year earlier (ICIS, IEA). That gap is not just a statistical quirk; it reflects damaged refineries in parts of Asia and the Middle East, feedstock uncertainty due to disrupted crude supply, and cautious utilization as operators face high costs and policy uncertainty.
Inventories tell the same story. Since February, global oil stocks have been drawing at nearly 2.8 mb/d, wiping out more than 500 million barrels in a matter of months (IEA). OECD commercial stocks are on track to fall below 2.3 billion barrels—their lowest level since records began in 2003—leaving barely 50 days of demand cover (EIA). Much of what remains is in crude, not in the refined fuels that trucks, planes, and ships actually burn.
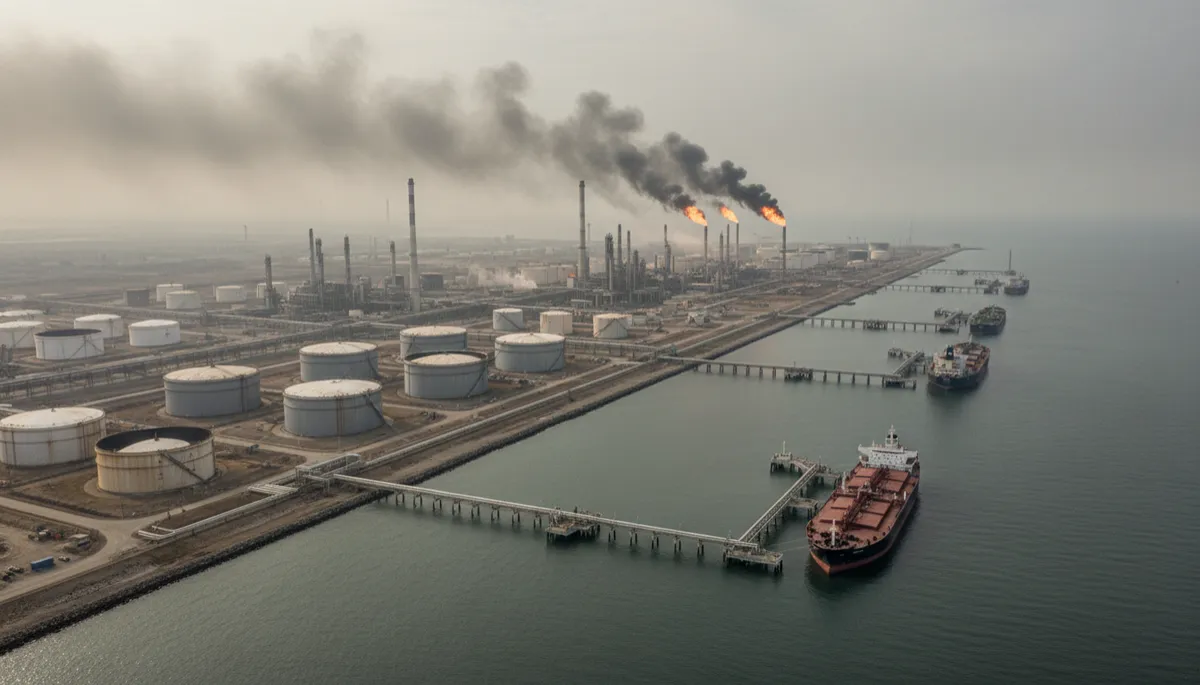
Refining capacity and product logistics, not crude barrels, now define fuel scarcity.
Allocations: Who Gets What, and When?
Under stress, markets move from price‑only rationing to allocations. In 2026, many refiners and trading houses shifted from open spot sales to allocation‑based contracts, prioritizing long‑term customers, domestic markets, and politically sensitive sectors such as power generation and food logistics. Governments have layered on export controls and minimum stockholding rules, effectively deciding which industries receive scarce diesel or jet fuel and which must cut back.
The result is a world where crude may be available somewhere, but refined products are not allocated evenly. Emerging markets often find themselves at the back of the line, facing rolling shortages or punitive spot prices, while wealthier importers secure long‑term volumes at the expense of flexibility and price stability.
📌 Index Signal: As allocations tighten, stress shifts from “Is there enough crude?” to “Who is allowed to receive refined fuel, on what terms, and for how long?”
Transport Costs: The 45% Premium on Moving Molecules
Even when oil is available and allocated, it still has to move. The OECD’s 2026 Economic Outlook highlights that freight and shipping costs for energy cargoes are roughly 45% above pre‑conflict levels. Insurance premia for tankers transiting risky routes have surged. Re‑routing away from Hormuz, the Red Sea, or other contested chokepoints adds thousands of nautical miles and weeks of transit time, compounding costs and tying up scarce vessels.
These costs feed directly into pump prices and freight rates. A barrel of diesel that once took a relatively short route from a Gulf refinery to an Asian or European port may now sail via longer, less direct passages—or be sourced from a completely different refining hub. Each detour and delay shows up as a higher transport cost component in the final price of fuel and goods.
Nationalization and Hoarding: When States Lock In Supply
Another key dimension of the stress index is the impact of nationalization and hoarding. In times of scarcity, producer states and some large importers increasingly treat oil and refined products as strategic assets rather than purely commercial commodities. This can mean:
Expanding state control over upstream assets and export terminals.
Prioritizing domestic refining and local markets over exports, even when exports would be more profitable.
Hoarding refined fuels in strategic reserves, further tightening global product availability.
For the stress index, nationalization and hoarding act like a multiplier: they can turn a manageable crude disruption into an acute refined‑product crisis by keeping barrels and products behind borders or under tight political control. Even when new crude routes open, hoarding behavior can prevent those gains from translating into lower prices and better availability for import‑dependent economies.
Geopolitical Risks at the Strait of Hormuz
No discussion of global oil stress is complete without the Strait of Hormuz, the narrow passage through which a significant share of the world’s seaborne oil and LNG normally flows. As of late 2026, the Strait is not fully closed but is far from normal. Vessel transits have at times fallen from more than 100 ships per day to single digits. Attacks, mines, missile threats and electronic interference have created a high‑risk environment where many ships sail with tracking systems off, and thousands of seafarers have been stranded or endangered (IMO, Kpler, BIS).
Temporary ceasefires and memorandums of understanding have delivered short‑lived relief, nudging risk from “extreme” to merely “severe.” But Iran’s ability to weaponize transit—by threatening to close the Strait, target tankers, or impose de‑facto transit fees—remains intact. Energy analysts widely expect that full normalization of Gulf flows will not occur before 2027, if at all, leaving a persistent risk premium of $5–$10 per barrel embedded in global prices (S&P Global, Chatham House).
Crude Logistics vs. Refined‑Product Availability: A Growing Disparity
Put these pieces together and a clear pattern emerges: crude logistics are recovering faster than refined‑product availability. Tankers are finding ways around chokepoints. Alternative pipelines are ramping up. Non‑Gulf producers are adding barrels. But refineries, product pipelines, and storage hubs are struggling to keep pace, especially in regions closest to conflict zones or heavily dependent on imported fuels.
In practical terms, that means a country can successfully source crude yet still face diesel shortages. It can secure long‑term supply contracts but still see aviation fuel rationed at its airports. The “index reading” here is that the physical bottlenecks have migrated downstream—from wellhead and tanker to distillation column, blending facility, and regional distribution networks.
📌 Core Insight: Crude can be redirected and re‑routed relatively quickly; refinery capacity and product logistics take years and billions of dollars to rebuild or relocate.
OPEC+ Decisions: Managing Scarcity in an Uncertain Market
The implications of OPEC+ decisions are magnified in this environment. With non‑OPEC supply growth unable to fully offset Gulf disruptions, OPEC+ policy has become the central balancing mechanism for global crude markets. Production quotas, voluntary cuts, and guidance on future capacity investments all feed directly into the stress index.
When OPEC+ signals caution—maintaining cuts or only slowly returning barrels—the immediate effect is to support crude prices. But the indirect effect is felt further downstream, where refiners face volatile feedstock costs and uncertain volumes. In a world already short of refined products, any perception that OPEC+ will keep the market “tight but stable” can paradoxically increase refined‑fuel price volatility, as traders and refiners scramble to secure product barrels ahead of potential supply squeezes.
Regional Trade Risks and Transportation Continuity
The stress index also captures regional trade risks and the current state of transportation continuity. Beyond Hormuz, routes through the Red Sea, Bab al‑Mandeb, and key canal and pipeline corridors face their own security and weather‑related disruptions. Port congestion, labor disputes, and infrastructure damage pile additional pressure on already stretched logistics chains.
Transportation continuity today is patchy and fragile. Some corridors—such as trans‑Atlantic crude flows from the Americas to Europe—have adapted relatively well, with stable shipping schedules and diversified supply. Others—especially routes reliant on Gulf exports or constrained regional refining—see intermittent outages, sudden demurrage spikes, and unpredictable delivery times. For many import‑dependent countries, it is no longer enough to sign a supply contract; they must also manage route risk and port risk as core parts of their energy strategy.
Rising Fuel Costs and the Real‑Economy Squeeze
All of this ultimately shows up in rising fuel costs that hit the retail and transportation sectors hardest. Even as headline crude prices occasionally soften on weak demand signals, diesel, gasoline and jet fuel prices remain elevated due to refining bottlenecks, allocation constraints, and high transport costs. The result is a painful disconnect: oil markets may look “less tight” on paper, yet logistics operators and consumers feel as if a crisis never ended.
Trucking companies face higher operating costs and are forced to pass on fuel surcharges. Airlines contend with stubbornly high jet fuel bills, limiting capacity growth and keeping airfares elevated. Retailers see higher freight rates baked into every shipment, squeezing margins and pushing up shelf prices. For households, the stress index is not an abstract gauge—it is the explanation behind costlier groceries, pricier flights, and more expensive deliveries.
Why the World Is Solving Crude Transport Faster Than Refined Fuel
The central argument of this Bell‑weather framework is clear: The world is solving the crude‑transport problem faster than it is solving the refined‑fuel problem. There are several reasons for this asymmetry:
Crude is fungible and reroutable. A barrel of crude can be shipped on a wide variety of tankers, stored in many types of tanks, and processed in refineries across continents. When one route is disrupted, traders can often find another—at a price.
Refining is capital‑intensive and slow to move. Building or upgrading a refinery takes years, regulatory approvals, and billions of dollars. You cannot rapidly relocate a complex hydrocracker the way you can redirect a tanker.
Product specifications fragment the market. Different regions require different fuel standards (for sulfur content, blending, emissions), making refined products less interchangeable than crude and complicating logistics.
Policy and nationalization amplify product risk. Governments are more likely to intervene in refined‑fuel markets—through subsidies, price caps, export bans and hoarding—because fuels are politically sensitive. These interventions often distort incentives and delay investment in new capacity.
In other words, the world has proven remarkably adept at keeping crude molecules flowing despite conflict and disruption. But it has been far less successful at ensuring the steady, affordable supply of refined fuels that power daily life. That gap is precisely what the New Bell‑weather Global Oil Supply & Transportation Stress Index is designed to highlight.
Looking Ahead: From Crisis Management to Structural Change
As we move toward 2027, most authoritative forecasts—from the IEA to the OECD—expect crude supply to rebound as Gulf flows normalize and non‑OPEC growth continues. But they also warn that refining bottlenecks and transport stress will linger unless governments and companies invest in new capacity, smarter logistics, and more resilient regional fuel networks.
For policymakers, the lesson is that emergency stock releases and crude diplomacy are necessary but not sufficient. For businesses—from airlines to retailers—the index underscores the need to hedge fuel exposure, diversify suppliers, and rethink logistics footprints. And for households, it offers a sober explanation for why fuel‑driven inflation feels so stubborn: the system is still solving yesterday’s crude crisis while tomorrow’s refined‑fuel challenge gathers pace.
📌 Key Takeaway: Until the world invests as much effort in refined‑product capacity and logistics as it does in crude‑transport workarounds, the global oil stress index will remain elevated—and consumers will keep paying the price.
Read the Deep Dive here:
Global Oil & Transportation Stress Dashboard
Week ending October 5, 2026 | January 2026 = baseline
The central signal this week is no longer simply “oil prices are high.” Crude availability is recovering faster than the system that converts, transports and distributes crude into usable diesel and jet fuel. Middle East crude exports briefly exceeded pre-war levels during September, yet tanker costs, refinery constraints, export restrictions and depleted inventories are keeping transportation fuels under severe pressure. Adding to that, a few national inventories are now being hoarded or blocked from distribution, making the availability less flexible causing local price spiking.
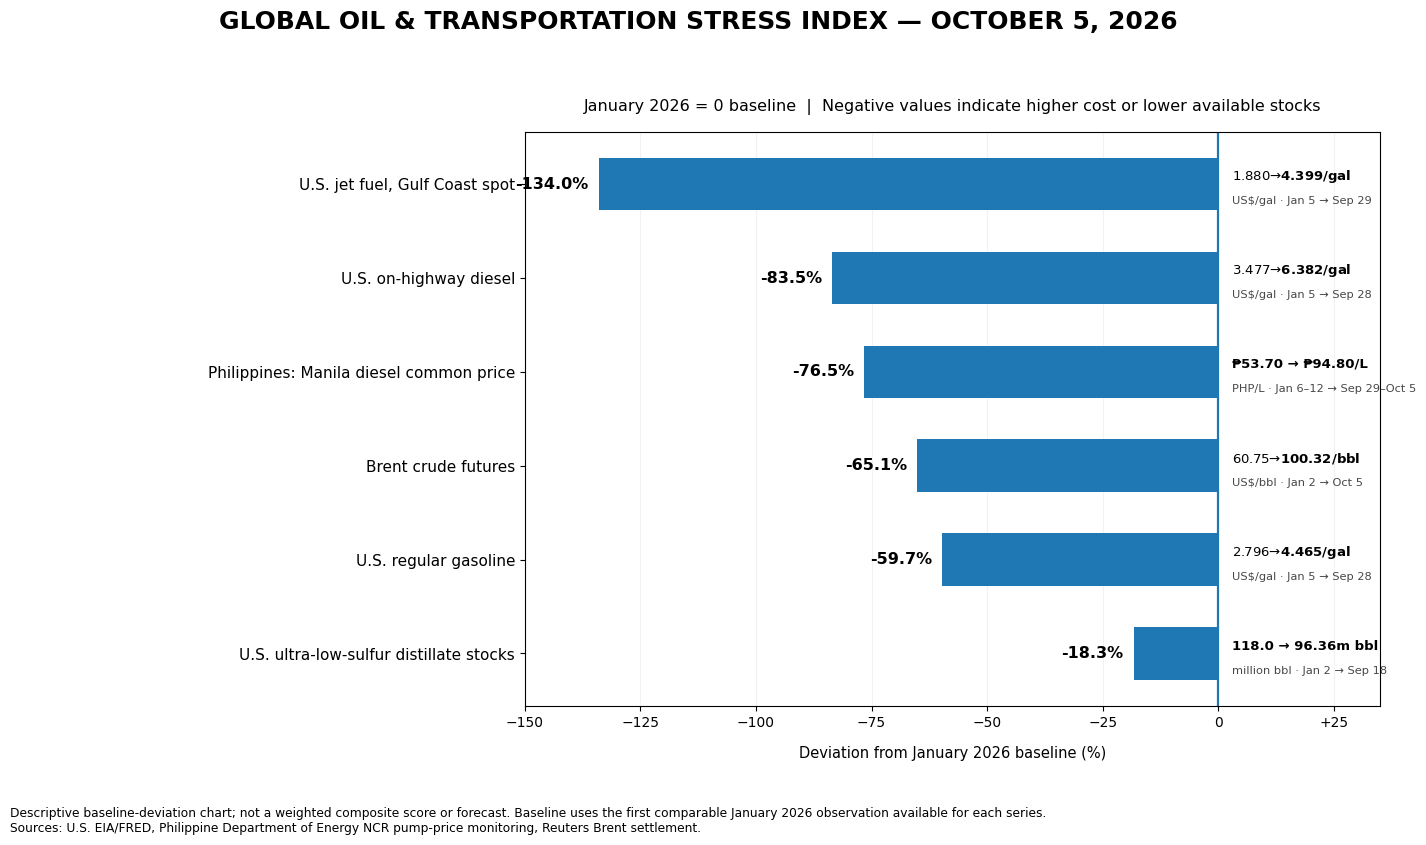
January U.S. diesel averaged $3.52/gal; the EIA-derived September 28 weekly reading was $6.382, an 81.3% deterioration from baseline, although it improved $0.147 from the prior week.
Bureau of Transportation Statistics Philippine diesel was about ₱57.60/L in January versus roughly ₱95.95/L after the September 29 rollback, still about 66.6% above baseline.
What Changed This Week
1. Crude supply improved substantially—but logistics did not. Gulf crude exports reached a seven-day average of approximately 18.3 million b/d, exceeding pre-war levels on 14 days during September. Hormuz crude flows have recovered to roughly 14.2 million b/d, about 80% of pre-war levels. Saudi and Iraqi exports were important contributors.
But Gulf-to-Asia VLCC freight reportedly exploded from roughly $30,000/day to as much as $1.2 million/day. Shipping can represent roughly 27% of delivered oil cost on some routes. This is why recovering crude volumes have not restored January economics.
2. Refined-product nationalism became a headline risk. Chinese refiners suspended October exports of diesel, gasoline and jet fuel outside Hong Kong and Macau to rebuild domestic inventories. Russia extended its diesel-export ban through October. These are implemented restrictions, not forecasts. USA is also considering a ban.
The countervailing development came from the G7: members agreed to release up to 100 million barrels of diesel and other petroleum reserves through coordinated action and avoided the threatened U.S. diesel-export restriction. That improves near-term availability while simultaneously consuming emergency buffers.
3. The inventory problem may last much longer than the shipping interruption. Saudi Aramco CEO Amin Nasser estimates that rebuilding global crude and fuel inventories could take up to two years, requiring approximately 2 million additional b/d for 18 months. This is an Aramco estimate—not an IEA forecast—but it is important for scenario planning.
4. Transportation is beginning to transmit the energy shock directly. IATA's latest global data show August air-cargo demand +4.4% YoY while capacity fell 0.1%. Jet fuel was 79.2% more expensive YoY and 8.3% higher month-over-month. Europe–Middle East cargo fell 12.1% and Middle East–Asia 11.0%.
5. The Philippines received some diesel relief—but the affordability problem remains. Diesel was rolled back approximately ₱7.57–₱7.60/L on September 29, and another ₱1.30/L diesel reduction is scheduled for October 6. Gasoline, however, increases ₱1.90–₱1.93 and kerosene ₱3.30.
Core Dashboard
Indicator | Jan. baseline | Latest verified observation | vs. Jan. | WoW / latest direction |
U.S. diesel | $3.52/gal | $6.382/gal, Sep. 28 | −81.3% | +2.3% improvement |
Philippine diesel | ~₱57.60/L | ~₱95.95/L, Sep. 29 Metro Manila avg. | −66.6% | Improving sharply |
PH traditional-jeepney minimum fare | ₱13 / first 4 km | ₱14 | −7.7% affordability | Worsened Sep. 28 |
U.S. Gulf jet fuel | Comparable Jan. spot observation not verified this run | $4.399/gal, Sep. 29 | N/A | Elevated |
Gulf crude exports | Normal/pre-war reference differs from Jan. methodology | 18.3M b/d 7-day peak | N/A | Strong improvement |
Hormuz crude flows | N/A comparable Jan. basis | ~14.2M b/d; ~80% pre-war | N/A | Improving |
Gulf→Asia VLCC freight | No verified Jan. matched observation | up to ~$1.2M/day | N/A | Severe stress |
Global air cargo demand | Jan.-matched series not available yet | +4.4% YoY Aug. | N/A | Demand strengthening |
Global air-cargo capacity | Jan.-matched series not available yet | −0.1% YoY Aug. | N/A | Tightening |
Euro-area inflation | 1.7% YoY Jan. | 3.8% Sep. flash | Not treated as comparable stress % | Worsening |
Euro-area energy inflation | Jan. matched value not verified | +18.8% YoY Sep. | N/A | Worsening |
Sources for U.S. diesel and aviation fuel: Bureau of Transportation Statistics and EIA-derived data.
Bureau of Transportation Statistics Euro-area inflation comes from Eurostat.
I am deliberately showing N/A rather than manufacturing January comparisons where an equivalent January observation was not verified.
HEADLINE RISK 1 — Energy Nationalism / Export Controls
Status: HIGH — worsened this week, but with an important G7 countermeasure.
China's October suspension removes potential diesel, gasoline and jet-fuel barrels from international markets while it rebuilds domestic inventories. Russia has separately extended its diesel-export ban through October.
The G7 took the opposite approach: coordinated reserve releases while avoiding intra-G7 export restrictions.
This creates two competing models:
China/Russia → preserve domestic fuel by restricting exports.
G7 → preserve trade flows by drawing strategic stocks.
That divergence is now one of the dashboard's most important forward indicators.
HEADLINE RISK 2 — Strategic Product Reserve Stress
Status: HIGH AND RISING.
The G7 agreed to release 100 million barrels of diesel and other reserves over four months, with significant diesel volumes intended early in the program.
This follows the much larger emergency-stock response earlier in the crisis. Japan said October 5 that it does not presently plan another national crude-reserve release, having already contributed substantial volumes earlier this year.
That distinction matters:
Emergency stocks improve today's physical market while reducing tomorrow's insurance.
The question governments increasingly need to answer is whether reserves are bridging a temporary disruption—or substituting for a supply structure that remains impaired.
HEADLINE RISK 3 — Critical Transport Continuity
Status: ELEVATED; cost stress is clearly visible, widespread physical service failure is not.
Air cargo provides one of the clearest signals. International Air Transport Association reports August global cargo demand +4.4% YoY against capacity −0.1%. North American capacity fell 2.5% and European capacity 3.5%, while jet fuel rose 79.2% YoY.
India's IndiGo announced higher passenger fuel charges beginning October 6 specifically because of higher aviation fuel costs—an observed example of fuel costs reaching passengers rather than merely appearing in commodity markets.
The Philippines is seeing the same transmission through its aviation fuel-surcharge framework. AirAsia/Teleport's October 1–15 domestic cargo schedule applies Level 17 fuel surcharges of approximately ₱4.10–₱7.28/kg, depending on route.
Philippines — Jeepney & Essential-Transport Watch
The regulated traditional-jeepney minimum fare became ₱14 for the first four kilometers on September 28, versus ₱13 previously; subsequent kilometers increased from ₱1.80 to ₱2.00. Modern-jeepney minimum fare rose from ₱15 to ₱17.
That means the traditional minimum fare increased 7.7%, while diesel remains roughly 67% above January's approximate level even after the September 29 rollback.
That gap explains why the ₱1 fare increase does not automatically restore operator economics.
PISTON's September 29–30 strike explicitly called for lower fuel prices and argued the fare increase was inadequate. Some operators continued running, so this should be recorded as a documented disruption/protest, not evidence of nationwide jeepney-system failure.
The latest verified DOE inventory figures I could locate remain the April readings—approximately 50.13 days diesel and 60.69 days jet fuel. I found no sufficiently authoritative current October product-by-product inventory release, so Monday's dashboard does not carry those April figures forward as though they were current.
Most importantly: there is still no verified evidence of a Philippine national diesel shortage.
China's export suspension increases regional replacement-cargo competition, but it should not be represented as a lost Philippine cargo without trade evidence.
U.S. School-Bus Bellwether
School transportation remains a secondary indicator, not a headline national-crisis measure.
There is growing evidence of diesel-driven budget pressure and some localized service responses. But reports mix fuel effects with driver availability, enrollment, contracting and broader district finances.
Accordingly, I am not assigning a national service-reduction percentage this week.
The signal remains:
Fuel budget pressure: HIGH.
Verified nationwide fuel-driven route reduction: N/A.
Evidence of isolated/localized reductions: YES.
That is a more defensible conclusion than extrapolating individual district cases into a national school-bus crisis.
Inflation and affordability
Eurostat's September flash estimate is particularly revealing. Euro-area inflation increased to 3.8% from 3.2% in August, while energy inflation accelerated to 18.8% from 14.3%. Food/alcohol/tobacco inflation was considerably lower at 1.4%.
This supports an important scenario distinction: the current inflation impulse remains disproportionately energy-driven, although prolonged transportation costs can eventually migrate into food and manufactured-goods prices.
Scenario Planning Implications
National governments and supply-chain leaders should now stress-test a scenario that is different from the one they faced six months ago.
Product security, not merely crude security. Having crude available does little for trucking or aviation if refining capacity, diesel availability or jet-fuel logistics remain constrained.
Export-control contagion. China's and Russia's actions demonstrate that refining capacity does not equal internationally available supply. Governments must model what happens if another major exporter prioritizes its domestic market.
Reserve composition. A barrel of emergency crude is not operationally identical to a barrel of diesel. Governments should know their usable days of cover by product.
Fuel allocation. If tightness intensifies, food distribution, agriculture, emergency services, public transport, military requirements and aviation could compete for the same middle-distillate pool.
Transport continuity. Watch actual route/frequency/capacity reductions—not merely commodity prices. That is where an energy shock becomes an economic-service shock.
Inflation and fiscal policy. Subsidies can preserve transportation service but transfer the energy shock onto government balance sheets.
Trade-route substitution. Saudi Arabia can restore crude volumes while $1-million-plus/day tanker economics keep delivered energy expensive. Alternative sourcing must therefore include vessel availability, insurance, storage, refinery compatibility and transit time—not merely identifying another producer.
Executive Interpretation
The most significant change this week is the decoupling of crude availability from transportation-fuel stress.
Middle Eastern crude exports have recovered remarkably quickly. Yet diesel remains exceptionally expensive, jet fuel is pressuring airline economics, Russia and China are restricting exports, governments are releasing strategic stocks, and shipping crude itself has become extraordinarily expensive.
Saudi Aramco's warning that inventory rebuilding could require as long as two years suggests that even a political settlement would not instantly return the system to January conditions.
That produces the week's central executive message:
The oil supply problem is improving. The transportation-energy problem is not solved.What does this mean for supply chain managers/
Based on the dashboard, I would replan around five priorities immediately:
Separate fuel risk from crude-oil risk. Stop using Brent as the main proxy for transportation exposure. Track diesel, jet fuel, bunker fuel, refinery availability, export restrictions, and delivered fuel cost separately. The current problem is increasingly about refined-product availability and logistics, not just whether crude exists.
Build a multi-source, multi-route contingency plan. Revalidate alternate suppliers, ports, carriers, and transport modes now—not after a disruption. For critical lanes, identify a primary route, secondary route, and emergency route, including the added lead time and landed cost of each.
Recalculate inventory and safety-stock policy for transport-dependent items. Components or products that depend on air freight, long-haul trucking, or constrained ocean routes may need temporary increases in safety stock or earlier order release. Focus on items where transport interruption would stop production or customer service, rather than raising inventory across the board.
Stress-test transportation capacity and contracts. Review carrier contracts for fuel surcharges, capacity guarantees, force-majeure language, route cancellation rights, and escalation clauses. Model scenarios such as diesel +25%, airfreight capacity −15%, ocean freight +50%, or loss of a key transport lane. The key question is: at what price or capacity level does the carrier reduce service rather than simply charge more?
Create a fuel-allocation and customer-priority plan before you need one. If transportation capacity becomes constrained, decide in advance which customers, SKUs, plants, and shipments get priority. Segment orders into critical, high-margin, contractual, and deferrable categories. This prevents emergency decisions from being made shipment by shipment.
The biggest change I would make in most supply-chain plans is this: move from a “cost optimization” mindset to a “continuity under constrained transportation” mindset. The cheapest supplier or route may no longer be the lowest-risk option.