Global Oil & Transportation Stress Insights
Energy Markets, Transportation, Risk Dashboard
Global Oil & Transportation Stress Dashboard: What Matters for the Week of November 9
For portfolio managers, risk officers and logistics leaders, this week’s data confirm a simple message: easing crude and pump prices have not restored refined‑product security. The focus now is diesel buffers, export behavior and transport continuity, not just headline oil benchmarks.
Five Changes That Matter for This Week’s Positioning
The dashboard for Monday’s publication distills a noisy tape into five investable shifts:
U.S. diesel buffers fell sharply. Commercial distillate stocks dropped to 99.3 million barrels in the week ended October 30, down 3.6 million week on week and sitting in roughly the 6th percentile versus the five‑year average, the lowest since 2003 (EIA, PIER20, StorageCurve).
Retail fuel eased, but remains far above January. U.S. on‑highway diesel slipped to $6.292/gal on November 2, still 81% above the January 5 baseline; gasoline is 48.5% higher versus January.
China may curtail November diesel exports. Traders surveyed by Reuters see less than 800,000 metric tons of November diesel exports versus 1.8 million in September, with consultancy estimates as low as ~580,000 tons as domestic stocks tighten (Reuters, Energy Aspects).
Consumer affordability worsened in the Philippines and Europe. Philippine October inflation reached 7.8% with transport inflation at 20.1%; euro‑area flash inflation printed 4.0% with energy inflation 20.8%, squeezing real transport demand and political tolerance.
Saudi crude pricing softened while shipping risk persisted. Saudi Aramco reportedly cut December Arab Light OSPs to Asia by $2/bbl versus November, even as product‑tanker incidents near Hormuz and security alerts around Yanbu kept route risk elevated.
Executive Assessment: Don’t Confuse Price Relief with Security
From a quantitative trader’s lens, the key mispricing risk is narrative compression: crude prices and retail fuel have eased from peaks, but inventory cover and export behavior signal continued fragility. The trade is not simply “short stress”; it is a relative‑value and optionality problem across crude, middle distillates, freight, and regional demand.
January Baseline Dashboard: Where We Stand Versus Zero
Indicator | Vs Jan (cost / stocks) | Trading Read‑Through |
|---|---|---|
U.S. diesel price | −81.0% | Margin pressure for trucking, upside for diesel cracks |
U.S. distillate stocks | −23.2% | Tight cover, volatility skew to upside on supply shocks |
Manila diesel price | −75.6% | Emerging‑market affordability and FX risk |
The signed convention (negative = higher cost or lower stocks) makes the dashboard a stress map rather than a composite index. For risk desks, it is a starting universe for stress scenarios, not a single tradable number.
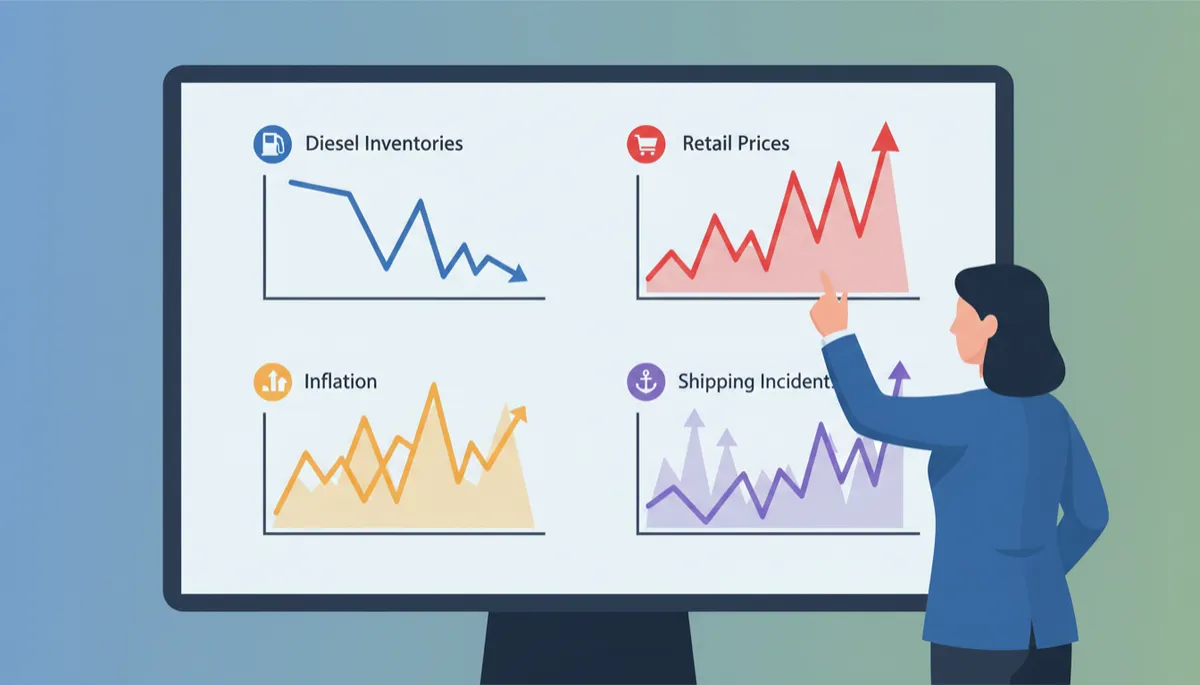
Treat refined-product, freight and inflation data as separate but linked risk factors.
Three Headline Risk Dimensions for Portfolios
Risk 1 – Energy Nationalism / Export Controls. China’s expected November diesel exports of roughly 580,000–800,000 tons represent a sharp pullback from September’s 1.8 million. Importantly, this is not a formal ban; it is a margin‑positive but volume‑negative regime. For traders, that argues for:
Long Asian middle‑distillate cracks versus Brent when export loadings underperform quotas.
Relative longs in import‑dependent refining and logistics equities that can pass through higher product prices.
Risk 2 – Strategic Product Reserve Stress. The U.S. SPR crude drawdown to 282.2 million barrels (−31.8% versus January) coexists with commercial diesel stocks under 100 million barrels. The Northeast Home Heating Oil Reserve loan of 300,000 barrels is a short‑term patch, not a structural buffer. This favors:
Buying winter‑skewed call spreads on diesel cracks or heating‑oil futures against short crude, positioning for product outperformance if cold weather bites.
Risk 3 – Critical Transport Continuity. IATA reports September air‑cargo demand +7.7% year over year against capacity +2.7%, with jet fuel more than doubling year over year. Philippine surcharge ceilings rose, and maritime incidents near Hormuz and Yanbu underline route risk. For portfolios, this supports:
Long freight rates or logistics names with strong pricing power versus fuel‑intensive, price‑capped carriers.
Regional Intelligence, Jeepney Economics and Scenario Trades
North America. Refinery utilization at 94.5% with flat distillate output and falling inventories points to tight cover rather than demand collapse. A stylized school‑bus fleet using 10,000 gallons/month now pays roughly $28,150 more than in January at unchanged consumption. For credit and muni investors, that is a budget‑stress signal, not yet a confirmed route‑cut count.
Europe. Headline inflation at 4.0% with 20.8% energy inflation and air‑cargo demand outpacing capacity create a squeeze on route economics. IEA’s warning that middle‑distillate constraints could persist into 2027 is a forecast, but it biases scenario planning toward structurally higher transport costs.
Asia. Saudi OSP cuts of $2/bbl for Arab Light to Asia signal a softer crude premium, but ship‑tracking data show Gulf exports down to 17.1 million bbl/day in October from 18.9 million in September. For importers, cheaper crude does not guarantee ample diesel barrels if Chinese exports undershoot and freight risk remains elevated.
Philippine jeepney economics. With Manila diesel at ₱94.30/L versus ₱53.70/L in January, a jeepney burning 20 L/day faces roughly ₱812 extra daily fuel cost. A ₱1 fare increase on 100 passengers recovers only ₱100 before discounts. The government’s UPLIFT program offers a ₱12/L discount up to 150 L/week, but November uptake is unclear. For investors in Philippine transport and banks, this is an operating viability question, not a confirmed shortage, but it raises credit and policy‑intervention risk.
Demand Destruction and Scenario Implications for Monday
IEA projects a 2.6 million bbl/day decline in world oil demand in 2026, with diesel roughly one‑quarter of that. Yet IATA’s data show air‑cargo volumes rising, underscoring that demand destruction is uneven. For strategy, think in scenarios:
Scenario A – Crude relief, diesel not replenished. Favor long diesel cracks and freight‑exposed equities versus crude benchmarks; entry when distillate stocks remain below the 20th percentile and front‑month cracks pull back 10–15% from recent highs, exit as inventories rebuild toward the five‑year mean.
Scenario B – Export licenses but missing cargoes. Track Chinese and Russian loadings; go long regional diesel spreads when realized exports undershoot quotas by >20% for multiple weeks.
Scenario C – Emergency product loans. Use options to buy upside tails in winter products when government loans are announced without clear replenishment plans.
Scenario D – Economic service withdrawal. In credit and equities, require carrier‑level evidence of uneconomic routes at current fuel and insurance costs before pricing in lasting volume loss.
Monday Newsletter Takeaway: Diesel Stocks Fall as Crude Eases
U.S. commercial distillate inventories at 99.3 million barrels, combined with diesel still 81% above January, argue against complacency. China’s likely export pullback, Philippine and European affordability stress, and Saudi pricing cuts amid persistent shipping risk all reinforce the same theme: the cheapest route is not automatically the most reliable route. For professionals managing capital or supply chains, this week’s dashboard is a prompt to separate crude price narratives from refined‑product reality and to position accordingly.
For the full report download here; https://drive.google.com/file/d/13eue6zbANxqIWIX0SqyyCGaSxpEFBqB_/view?usp=sharing