
Weekly Oil Stress Index
GLOBAL OIL & TRANSPORTATION STRESS DASHBOARD
SUNDAY RESEARCH EDITION•OCTOBER 25, 2026•FOR MONDAY, OCTOBER 26 PUBLICATION
Geography: North America | Europe | Asia (Philippines priority)Baseline: first comparable January 2026 observation
EXECUTIVE SUMMARY — WHAT CHANGED THIS WEEK
1.Fuel-price divergence. In the EIA matched weeks ending Oct 9 and Oct 16, Brent eased 1.4%, while Gulf Coast ULSD rose 4.2% and jet fuel rose 2.2%. U.S. retail diesel rose to $6.276/gal on Oct 19. This is the strongest current signal that crude price direction is not a reliable proxy for transportation-fuel cost. [E2–E4]
2.U.S. inventory mix changed. Distillate inventories rose 1.7 million barrels to 104.3 million during the week ending Oct 16, but gasoline inventories fell 3.0 million to 205.3 million; jet fuel slipped to 42.6 million. Commercial product stocks are not government emergency product reserves. [E1]
3.Asian refiners are changing how they buy and move crude. Reuters reported Oct 20 that Asian buyers are substituting smaller tankers and delivered-price contracts amid U.S.–Asia crude freight estimates near $40/barrel. These are reported transaction changes and industry freight estimates, not a universal rate. [R1]
4.Philippine diesel affordability remains strained. The DOE Manila City common diesel price was ₱90.50/L for Oct 13–19 versus ₱53.70/L in January. Shell separately announced a ₱2.60/L increase effective Oct 20; it must not be spliced into the DOE city series. [P2–P5]
5.Some Russian diesel is moving, but arrival is pending. AP reported Oct 23 that a 40,000-ton Russian diesel tanker departed toward the U.S., expected in New York Nov 7. Departure is not a completed delivery or proof of broad supply normalization. [R2]
Executive assessment: Refined-product economics and physical transport logistics remain the leading operational constraints. This report measures specific observations; it does not calculate a discretionary composite stress score.
1 | JANUARY-BASELINE DEVIATION DASHBOARD
Sign convention: NEGATIVE = higher cost or lower available supply; POSITIVE = improvement. WoW uses matched observation types and periods, not unrelated price series. “N/A” is missing or noncomparable, never zero.
Indicator / unit | Jan 2026 | Latest | vs Jan | WoW |
U.S. Gulf Coast ULSD spot | $1.991 | $4.836 | -142.9% | -4.2% |
U.S. Gulf Coast jet fuel spot | $1.873 | $4.500 | -140.2% | -2.2% |
Brent crude spot | $62.93 | $125.59 | -99.6% | +1.4% |
U.S. on-highway diesel | $3.477 | $6.276 | -80.5% | -1.6% |
Manila City diesel, common price | ₱53.70 | ₱90.50 | -68.5% | +3.2% |
U.S. regular gasoline | $2.796 | $4.284 | -53.2% | +1.1% |
U.S. commercial ULSD stocks | 118.0m | 92.9m | -21.3% | +1.4% |
U.S. commercial distillate stocks | 129.3m | 104.3m | -19.3% | +1.7% |
U.S. commercial gasoline stocks | 242.0m | 205.3m | -15.2% | -1.4% |
U.S. commercial jet-fuel stocks | 44.0m | 42.6m | -3.2% | -0.5% |
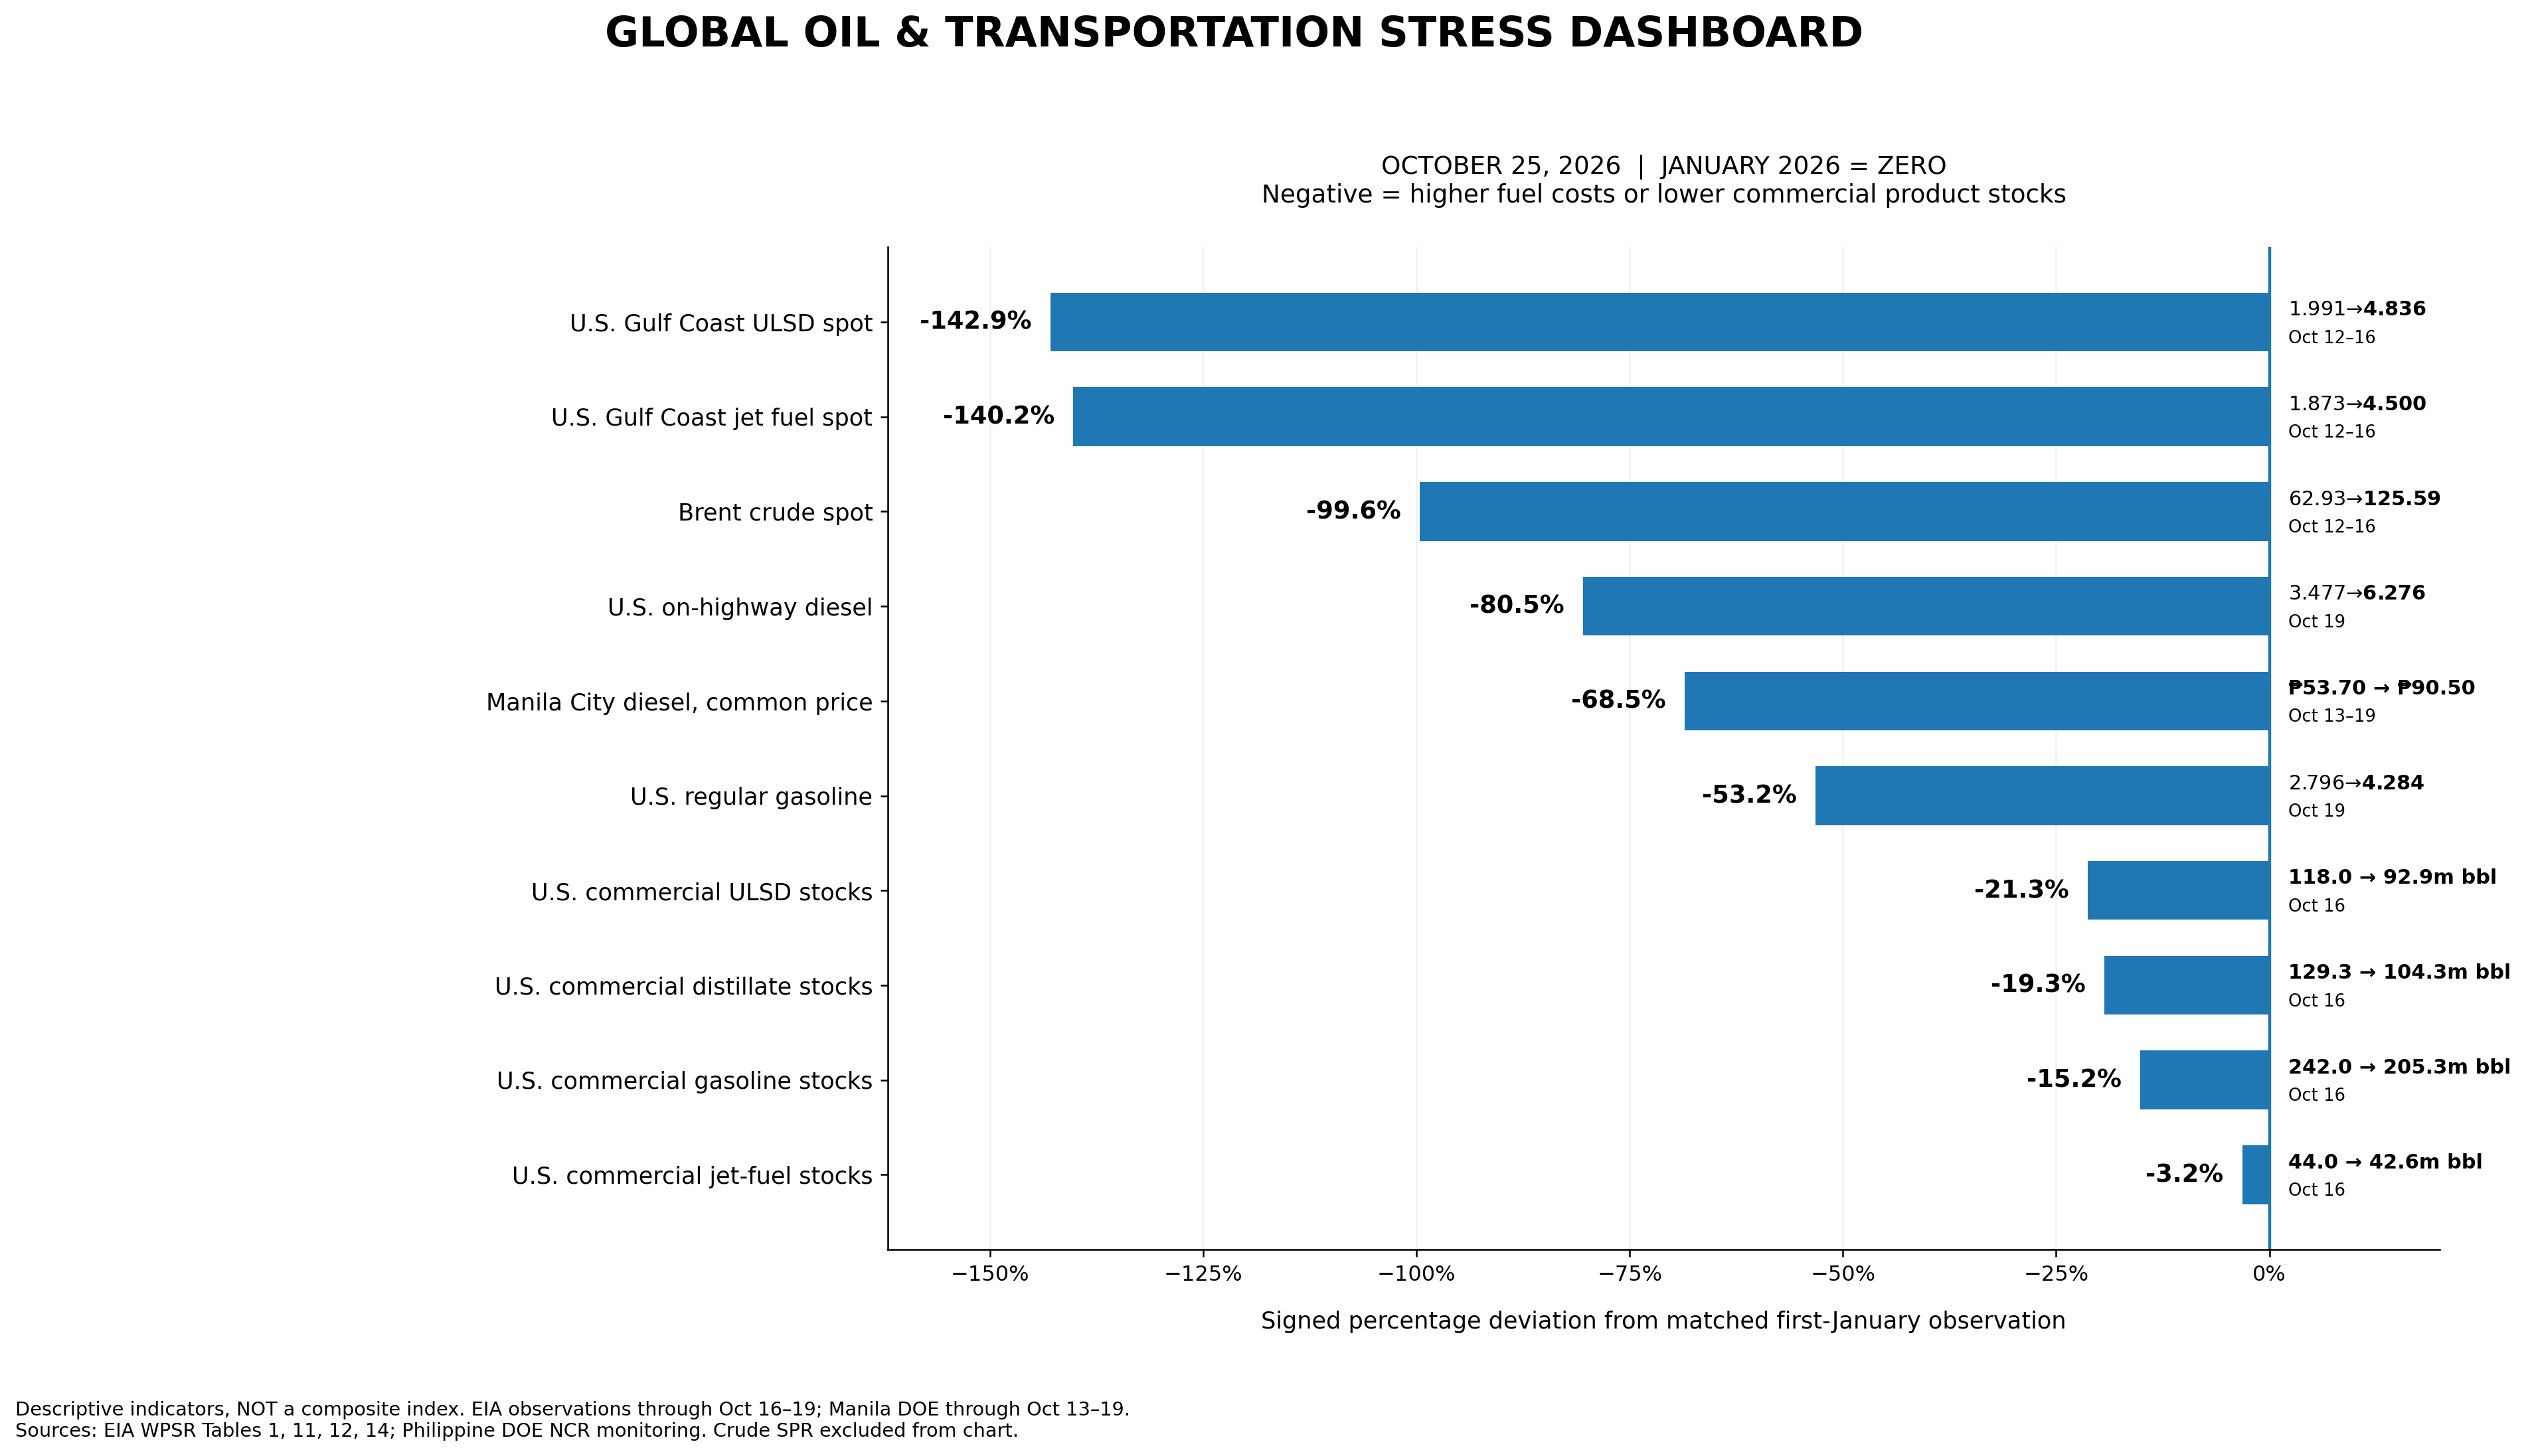
Date/source key: Brent, ULSD and jet are matched five-day averages (Jan 5–9, Oct 5–9, Oct 12–16), EIA Tables 11–12. Retail fuel is Jan 5 / Oct 12 / Oct 19, EIA Table 14. Commercial inventories are Jan 2 / Oct 9 / Oct 16, EIA Table 1. Manila DOE common diesel price is Jan 6–12 / Oct 6–12 / Oct 13–19. [E1–E8; P2–P4]
Chart 1. Signed descriptive deviations; crude Strategic Petroleum Reserve deliberately excluded.
2 | THE THREE HEADLINE RISK DIMENSIONS
ENERGY NATIONALISM / EXPORT-CONTROL RISK
Current status: SELECTIVE EASING, BUT POLICY RISK PERSISTS. China approved October refined-product exports after a brief pause; Reuters reported roughly 3.7 million metric tons approved, not all delivered. Russia partially reopened diesel exports, and AP documented one U.S.-bound departure Oct 23. The IEA cautions that damaged Russian refining capacity may limit the actual supply benefit. A general implemented U.S. diesel-export ban or new Indian product-export restriction was not verified in this review. [R3; R2; I1]
Planning implication: maintain two separate checks for every alternate fuel source: physical refinery/export capacity and legal permission to export. Record approvals, loaded departures, discharge and final receipt as distinct milestones.
STRATEGIC PRODUCT RESERVE STRESS
Current status: EMERGENCY ACTION PLANNED/ACCELERATING; DELIVERY NOT FULLY VERIFIED. The IEA/G7 framework calls for faster releases, with more than 20 million barrels of diesel in specific release plans. These are intended product releases, not evidence of 20 million barrels already delivered. The U.S. crude SPR was 282.7 million barrels on Oct 16 versus 413.5 million on Jan 2 (−31.6%); it is crude, not diesel. U.S. commercial diesel, jet and gasoline stocks must not be mislabeled government emergency reserves. [I2; E1; E5]
The Philippine DOE reported 60.80 days of diesel cover, 60.56 jet and 57.17 gasoline as of Sep 11; current October product-cover figures were not independently verified for this draft. Product cover is not automatically a dedicated state emergency reserve. [P7]
CRITICAL TRANSPORT CONTINUITY
Current status: ECONOMIC PRESSURE VERIFIED; NATIONAL SERVICE FAILURE NOT VERIFIED. Elevated fuel prices and vessel-freight costs can make routes commercially unattractive without creating a physical shortage. Reuters reports Asian tanker substitutions and delivered-basis contracts; these are changes in procurement behavior, not proof of universal freight shutdowns. No new verified nationwide fuel-driven jeepney or U.S. school-bus route closure count was established. [R1; P6]
The latest IATA air-cargo release remains August: global CTKs +4.4% YoY, ACTK −0.1% YoY; Europe–Middle East cargo −12.1% and Middle East–Asia −11.0%. These are August YoY observations, not October week-on-week fuel-attributable airline route cuts. [A1]
3 | REGIONAL OPERATIONAL READOUT
NORTH AMERICA | refined products, exports, school transportation
EIA retail diesel rose from $6.179 on Oct 12 to $6.276/gal on Oct 19 (+1.6% price; signed WoW −1.6%). Commercial distillate inventories rebounded 1.7 million barrels to 104.3 million in the week ending Oct 16; gasoline stocks declined 3.0 million. U.S. all-product exports averaged 7.407 million b/d versus 7.374 million the preceding week, but this is NOT a diesel/jet destination breakdown, nor evidence of export profitability. [E1; E4]
School-bus sensitivity only: a hypothetical fleet using 10,000 gallons/month would face $27,990 more monthly diesel expense at the Oct 19 national price than at the Jan 5 price, before discounts and contracts. No verified national fuel-specific count of route reductions, cancelled nonrequired trips, eligibility changes, vendor surcharges or budget transfers was found. Driver shortages and enrollment changes remain separate causes.
EUROPE | inflation, product sourcing and freight
Eurostat confirmed September euro-area annual inflation of 3.8%, up from 3.2% in August (+0.6 percentage point, NOT a 0.6% WoW price change). Energy contributed +1.71 percentage points to the annual rate. The IEA reports high freight and crude acquisition costs squeezing European and Asian refinery margins, creating a risk of economic run cuts; no universal implemented refinery curtailment is inferred. [EU1; I1]
ASIA / PHILIPPINES | diesel, jeepneys, aviation and trade routes
The matched Manila City DOE diesel common price declined from ₱93.50/L (Oct 6–12) to ₱90.50/L (Oct 13–19), still +68.5% above ₱53.70/L in Jan 6–12. Shell separately announced a ₱2.60/L diesel hike effective Oct 20; no matched DOE city-common reading for Oct 20–26 was verified, so that adjustment is NOT inserted into the baseline chart. [P2–P5]
The Philippine government confirmed the traditional-jeepney first-four-kilometer minimum fare at ₱14, up from ₱13, and the modern-jeepney minimum at ₱17, up from ₱15 (September decision). Route and distance matter. Illustrative fuel sensitivity: 20 liters/day costs ₱736 more at ₱90.50/L than at the January Manila common price, before fuel aid, discounts and other costs. This is NOT a typical operator profit estimate. [P6]
The PSA reported September Philippine inflation of 7.2% YoY, transport 14.6%, and food 6.8%; the period is September, not a new October release. Philippine DOE reported 102,356 fuel-subsidy beneficiaries and ₱718.10 million availed as of Sep 9; newer disbursements N/A. No nationwide Philippine diesel shortage or jeepney collapse is established. [P8; P7]
Reuters reports that some Saudi and UAE producers are selling crude on a delivered basis and that Asian refiners are using Aframax tankers and long-term charters. Estimated U.S.–Asia crude freight of roughly $40/bbl is route-specific, not a global freight index. Actual new Saudi cargo discharge quantities in the EU versus Asia, Philippine import origins and product delivery dates remain N/A. [R1]
4 | DEMAND, AIRFARE, CARGO, OCEAN AND ROAD FREIGHT
Observed demand weakness: the IEA reports OECD nontransport gasoil consumption −8% YoY and diesel deliveries −2% YoY in the five months through July. Its projected global oil-demand contraction of 2.6 million b/d in 2026 is a FORECAST, not a measured 2026 full-year outcome. This is evidence of selective demand reduction, not a universal transport shutdown. [I1]
Airfare and capacity: Philippine CAB authorized a lower Level 16 fuel-surcharge ceiling for Oct 16–31 after Level 17 for Oct 1–15; a surcharge ceiling is not an observed fare paid or implemented route cut. IATA August cargo demand rose despite high jet costs. Actual passenger belly-cargo capacity lost specifically to fuel-driven passenger route reductions remains N/A. [A1]
Ocean and road freight: Reuters Oct 20 documents material substitution among tanker sizes and delivered-price contracts. Comparable January-to-October container-freight index, bunker fuel benchmark, road-freight service withdrawals and rail cancellations were not verified; report as N/A. [R1]
5 | DATA GAPS / NONCOMPARABLE SERIES
Indicator | Latest known / N/A | Why not scored |
Philippine diesel/jet/gasoline days cover | Sep 11: diesel 60.80d; jet 60.56d; gasoline 57.1 | Older DOE observation; current Oct 25 update not independently verified |
Philippine October 20–26 DOE Manila common price | Oct 20: Shell announced +₱2.60/L diesel | A brand adjustment is not an updated matched DOE city common price |
Saudi crude deliveries by EU/Asia destination | Oct 20: delivered-basis contracts reported | No matched actual destination-level discharge data |
Philippine product import origins / completed cargoes | N/A | No new verified origin-to-arrival dataset |
U.S. diesel/jet export volumes by destination | N/A | EIA all-product exports are not diesel/jet or destination-specific |
Ocean container index vs January | N/A | No comparable official matched weekly benchmark verified |
Airline route/seat cuts caused by fuel | N/A | Do not infer from total capacity or security events |
Passenger belly cargo loss caused by route cuts | N/A | Not derivable from aggregate ACTK |
National fuel-driven U.S. school-bus route reductions | N/A | No nationally verified fuel-specific count |
National fuel-driven Philippine jeepney closures | N/A | No verified nationwide route closure count |
Refined-product emergency reserves by country | N/A | Commercial stocks and crude SPR are different categories |
Road/rail freight fuel-specific cancellations | N/A | No matched fuel-attributable service count |
6 | SCENARIO PLANNING IMPLICATIONS
National governments: plan separately for crude access, diesel/jet/gasoline availability, product-specific emergency reserves, fuel allocation to food, health, emergency services and public transport, and the fiscal cost of relief. Export-control contagion can reduce accessible trade volumes even when refining capacity exists. Avoid treating an announced release as a completed delivery.
Supply-chain leaders: model route substitution on landed cost (fuel, vessel, insurance, financing, transit), not commodity price alone. Set operational triggers for carrier service withdrawal, not just surcharge increases. Higher transportation cost, economically unavailable capacity and physical fuel shortage require different mitigations. Inflation and selective demand destruction should inform inventory planning and customer prioritization.
7 | MONDAY WEBSITE / NEWSLETTER SUMMARY
Crude Eases, but Transportation Fuel Tightens Again
The latest U.S. energy data illustrate a split market: Brent crude eased 1.4% between matched reporting weeks, while Gulf Coast wholesale ultra-low-sulfur diesel increased 4.2% and jet fuel 2.2%. U.S. retail diesel also rose to $6.276 per gallon on October 19. Distillate inventories recovered slightly, but gasoline and jet-fuel stocks declined.
In Asia, refiners are responding to unusually expensive shipping by using smaller tankers and delivered-price contracts. Reuters estimates U.S.–Asia crude freight at roughly $40 per barrel on affected movements. The Philippines continues to face a major affordability gap: the latest matched DOE Manila common diesel price was ₱90.50 per liter, 68.5% above January, before a separately announced October 20 brand-specific increase.
Export approvals and emergency reserve plans can help, but approvals are not delivered fuel. The managerial priority is to protect transport continuity by checking actual cargo arrivals, carrier economics and product-specific inventory—not merely the Brent price.
8 | TALKTUESDAY — OCTOBER 27 ARTICLE OPTIONS
6.Crude Fell. Diesel Rose. Why Supply Chains Need a New Fuel Dashboard — Lead with the matched EIA spot divergence and practical freight-budget triggers.
7.Forty Dollars a Barrel Just to Ship Crude: Asia Is Rewriting Its Sourcing Playbook — Use Reuters-documented smaller tanker and delivered-basis transactions; avoid claiming a global freight rate.
8.A Diesel Tanker Has Departed. Has the Supply Crisis Improved? — Distinguish Russian vessel departure, arrival and sustained product supply recovery.
9.The Jeepney Affordability Gap: Fuel, Fares and Commuter Economics — Use official DOE city fuel prices, fare decision and a transparent operator sensitivity example.
10.Emergency Fuel Stocks: Bridging a Disruption or Spending the Buffer? — Separate planned diesel releases from crude SPR drawdowns and completed physical deliveries.
9 | LINKED SOURCE REGISTER
Verification hierarchy: official measured data > official decision > observed/reportable transaction > industry estimate > forecast. Dates below are source release dates or observation windows, not a claim that all measures are synchronized.
[E1] EIA | Oct 21 | U.S. Petroleum Balance Sheet, week ending Oct 16 | official observationSource ↗
[E2] EIA | Oct 21 | Brent spot-price daily observations | official observationSource ↗
[E3] EIA | Oct 21 | ULSD and jet-fuel spot prices | official observationSource ↗
[E4] EIA | Oct 21 | Retail diesel and gasoline, through Oct 19 | official observationSource ↗
[E5] EIA | Jan 7 | January 2 petroleum stocks | official baselineSource ↗
[E6] EIA | Jan 14 | January 5–9 Brent spot prices | official baselineSource ↗
[E7] EIA | Jan 14 | January 5–9 ULSD/jet spot prices | official baselineSource ↗
[E8] EIA | Jan 7 | January 5 retail fuel prices | official baselineSource ↗
[P1] Philippine DOE | accessed Oct 25 | NCR official pump-price report index | official indexSource ↗
[P2] Philippine DOE | Jan 6–12 | NCR city fuel-price baseline | official baselineSource ↗
[P3] Philippine DOE | Oct 6–12 | NCR city fuel-price prior week | official observationSource ↗
[P4] Philippine DOE | Oct 13–19 | NCR city fuel-price latest verified | official observationSource ↗
[P5] GMA News | Oct 19 | Shell October 20 diesel +₱2.60/L implementation | reported company announcementSource ↗
[P6] Philippine PCO | Sep 28 | Jeepney fare decision and fuel-aid context | official policySource ↗
[P7] Philippine DOE | Sep 15 | Sep 11 product days of cover and subsidy totals | official older observationSource ↗
[P8] Philippine PSA | Oct 6 | September national inflation release | official observationSource ↗
[I1] IEA | Oct 14 | Oil Market Report: diesel supply, demand, shipping | official assessment/forecastSource ↗
[I2] S&P Global / IEA | Oct 15 | IEA reserve-release acceleration, >20m diesel planned | reported official decision; not deliveredSource ↗
[R1] Reuters | Oct 20 | Asian refinery tanker substitutions, freight estimates | reported transactions/estimatesSource ↗
[R2] Associated Press | Oct 23 | Russian diesel tanker departed toward U.S. | reported departure; arrival pendingSource ↗
[R3] Reuters | Oct 9 | China refined-product export approvals | reported approvals; not deliverySource ↗
[EU1] Eurostat | Oct 16 | September euro-area inflation final | official observationSource ↗
[A1] IATA | Sep 29 | August air-cargo demand/capacity report | industry observationSource ↗
10 | FIVE ACTIONS FOR SUPPLY-CHAIN MANAGERS
1. Reprice fuel exposure within 48 hours
Action: Recalculate lane and fleet budgets using the Oct 19 EIA diesel price and matched ULSD/jet benchmarks; separate spot fuel risk from carrier surcharge formulas.
Monitor: North America: EIA Weekly Petroleum Status Report; Europe: Eurostat and IEA; Asia/Philippines: DOE NCR pump monitoring, IATA.
2. Verify replacement routes and delivered costs within seven days
Action: Compare at least two alternate origins and two vessel/route options for critical imports. Include $/barrel freight, insurance, vessel class, port availability and ETA; do not use the reported $40/bbl U.S.–Asia freight estimate as a universal rate.
Monitor: North America: EIA trade tables and U.S. Maritime Administration; Europe: Baltic Exchange, European Maritime Safety Agency; Asia: Maritime and Port Authority of Singapore, Philippine Ports Authority, Reuters/Kpler.
3. Separate approvals, departures and arrivals
Action: Track diesel export authorizations, loaded vessels, port discharge and inventory receipts. Treat China approvals, the Russian U.S.-bound tanker and IEA diesel releases as separate execution stages.
Monitor: North America: EIA/DOE; Europe: IEA and European Commission; Asia: China customs/export notices, Philippine DOE, port authorities.
4. Stress-test essential transportation continuity
Action: Ask road, school-bus, jeepney and air-freight providers for the fuel-price or capacity threshold that would cause an actual frequency/route reduction; document evidence before classifying it as fuel-driven.
Monitor: North America: National School Transportation Association and district budget records; Europe: EUROCONTROL and Eurostat; Philippines: LTFRB, DOTr, CAB and DOE.
5. Set reserve and demand escalation triggers
Action: Review diesel/jet/gasoline cover separately from crude. Escalate when stock cover, transport reliability or product availability breaches internally approved limits; adjust inventory selectively for critical SKUs.
Monitor: North America: EIA distillate/jet/gasoline tables; Europe: IEA/Eurostat; Asia: Philippine DOE product-cover updates, IATA cargo and PSA inflation.